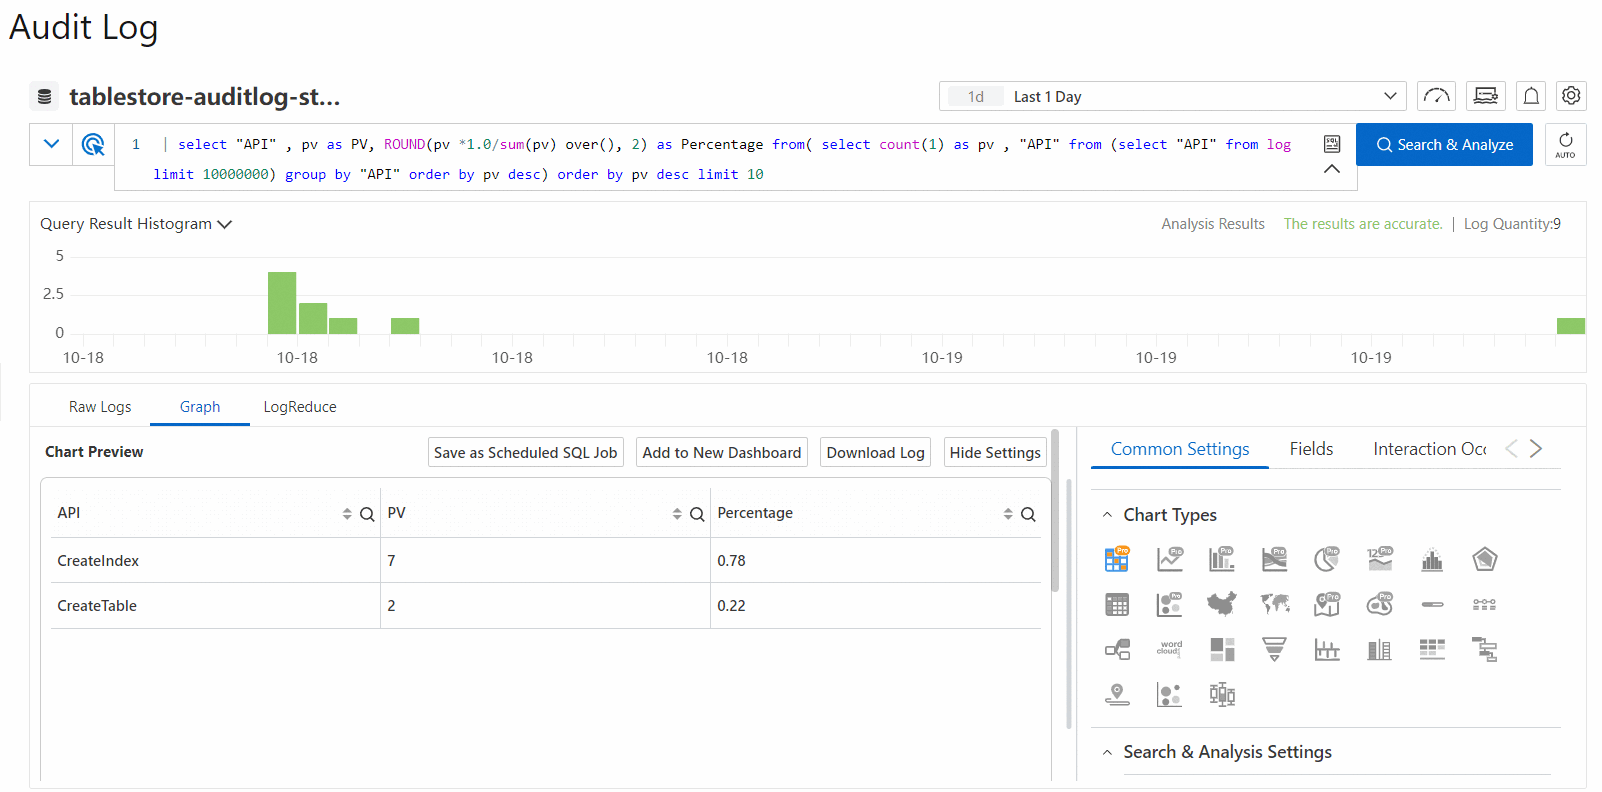
After you execute a query statement, you can view charts that display the query and analysis results on the Graph tab. The charts are suitable for log queries based on the specified field such as API or HttpStatus. This topic describes the operations that you can perform on logs on the Graph tab.
UI of the Graph tab
You can use charts to display results of multiple query statements. You can also use charts to visualize the results of query statements based on your business requirements. For more information, see Overview of charts (Pro).
Add charts to a dashboard
A dashboard is used for real-time data analysis. You can save the results of query statements as charts to a dashboard.
On the Graph tab, click Add to New Dashboard.
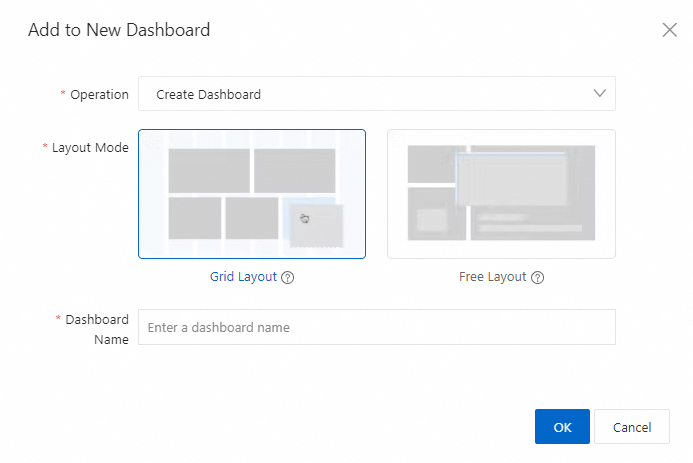
In the Add to New Dashboard dialog box, create a dashboard or select an existing dashboard based on your business requirements.
Create a dashboard
Set the Operation parameter to Create Dashboard.
Set the Layout Mode parameter to Grid Layout or Free Layout.
Specify a name for the dashboard.
Select an existing dashboard
Set the Operation parameter to Add to Existing Dashboard.
Select an existing dashboard.
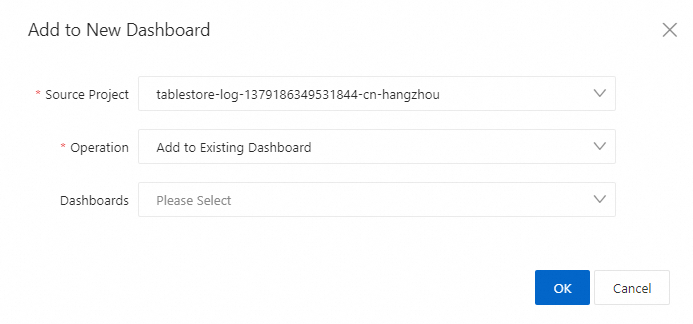
Click OK.
Save as a scheduled SQL job
After you create a scheduled SQL job, you can view the execution results of the scheduled SQL job in the Logstore.
On the Graph tab, click Save as Scheduled SQL Job.
In the Create Scheduled SQL panel, create a scheduled SQL job.
In the Compute Settings step, configure the parameters and click Next. The following table describes the parameters.
Parameter
Description
Job Name
The name of the Scheduled SQL job.
Job Description
The description of the Scheduled SQL job.
Resource Pool
The resource pool that is used for data analysis. Simple Log Service provides an enhanced type of resource pool.
The enhanced type of resource pool utilizes the computing capability of Dedicated SQL to meet concurrent analysis requirements. It isolates resources between Scheduled SQL and your SQL analysis operations in the console. You are charged for the enhanced type of resource pool based on the CPU time that is consumed by your SQL analysis operations. For more information, see Enable Dedicated SQL.
Write Mode
Select Import Data from Logstore to Logstore. The Scheduled SQL job processes the data in the source Logstore and saves the processed data to the destination Logstore.
SQL Code
The query statement. By default, the system displays the statement that you entered in 4. The preview operation that is provided for this parameter has the same effect as the preview operation in 4. You can click Preview to check whether the query statement is valid and whether the query and analysis result contains data.
When the Scheduled SQL job runs, Simple Log Service executes the query statement to analyze data.
Source Project/Logstore
The project and Logstore to which the source data belongs.
Target
Target Region
The region where the destination project resides.
Target Project
The name of the destination project that stores the result of the query statement.
Target Store
The name of the destination Logstore that stores the result of the query statement.
Write Authorization
The method that is used to authorize the Scheduled SQL job to write data to the destination Logstore. Valid values:
Default Role: The Scheduled SQL job assumes the AliyunLogETLRole system role to write the analysis result to the destination Logstore.
ImportantThe first time that you create a Scheduled SQL job, authorization is required and must be completed by using the Alibaba Cloud account to which the destination project belongs. You do not need to perform authorization when you create subsequent Scheduled SQL jobs.
Custom Role: The Scheduled SQL job assumes a custom role to write the analysis result to the destination Logstore.
You must grant the custom role the permissions to write data to the destination Logstore. Then, enter the Alibaba Cloud Resource Name (ARN) of the custom role in the Role ARN field. For information about how to obtain the ARN, see one of the following topics based on your business scenario:
If the source Logstore and the destination Logstore belong to the same Alibaba Cloud account, obtain the ARN by following the instructions that are provided in Step 2: Grant the RAM role the permissions to write data to a destination Logstore.
If the source Logstore and the destination Logstore belong to different Alibaba Cloud accounts, obtain the ARN by following the instructions that are provided in Step 2: Grant RAM Role B the permissions to write data to a destination Logstore.
SQL Execution Authorization
The method that is used to authorize the Scheduled SQL job to read data from the source Logstore and analyze the data by using query statements in the current project. Valid values:
Default Role: The Scheduled SQL job assumes the AliyunLogETLRole system role to perform the required operations.
ImportantThe first time that you create a Scheduled SQL job, authorization is required and must be completed by using the Alibaba Cloud account to which the destination project belongs. You do not need to perform authorization when you create subsequent Scheduled SQL jobs.
Custom Role: The Scheduled SQL job assumes a custom role to perform the required operations.
You must grant the custom role the required permissions. Then, enter the ARN of the custom role in the Role ARN field. For more information, see Step 1: Grant the RAM role the permissions to analyze log data in a source Logstore.
In the Scheduling Settings step, configure the parameters and click OK. The following table describes the parameters.
Parameter
Description
Specify Scheduling Interval
The frequency at which the Scheduled SQL job is scheduled. An instance is generated each time the Scheduled SQL job is scheduled. This parameter specifies the scheduled time for each instance. Valid values:
Hourly: The Scheduled SQL job is scheduled every hour.
Daily: The Scheduled SQL job is scheduled at a fixed point in time every day.
Weekly: The Scheduled SQL job is scheduled at a fixed point in time on a fixed day of each week.
Fixed Interval: The Scheduled SQL job is scheduled at a fixed interval.
Cron: The Scheduled SQL job is scheduled at an interval that is specified by a cron expression.
A cron expression can specify an interval that is accurate to minutes. The cron expression is based on the 24-hour clock. For example, 0 0/1 * * * indicates that the Scheduled SQL job is scheduled at an interval of 1 hour from 00:00.
If you want to specify the time zone, select Cron. For information about common time zones, see Time zones.
Scheduling Time Range
The time range during which the Scheduled SQL job is scheduled. Valid values:
From Specific Time: If you select this option, you must specify the point in time at which the first instance of the Scheduled SQL job starts to run.
Within Specific Period: If you select this option, you must specify a time range within which the instances of the Scheduled SQL job can run.
ImportantThe instances of the Scheduled SQL job can run only within the specified time range. After the end of the time range, the Scheduled SQL job no longer generates instances.
SQL Time Window
The time window of logs that are analyzed when the Scheduled SQL job runs. This parameter must be configured together with the Scheduling Time Range parameter. The duration that is specified by this parameter can be up to five times the duration that is specified by the Specify Scheduling Interval parameter. The start time and end time of the time window must be within 24 hours. For more information, see Time expression syntax.
For example, the Specify Scheduling Interval parameter is set to Fixed Interval 10 Minutes, the Start Time parameter is set to 2021-04-01 00:00:00, the Delay Task parameter is set to 30 Seconds, and the SQL Time Window parameter is set to [@m-10m,@m). In this example, the first instance of the Scheduled SQL job is generated at 00:00:30 to analyze the logs that fall within the time range
[23:50:00,00:00:00). For more information, see Scheduling and running scenarios.SQL Timeout
The threshold of automatic retries if the SQL analysis operation fails. If the retry period exceeds the specified maximum period or the number of retries exceeds the upper limit, the instance stops and the instance status changes to FAILED. You can retry the instance based on the failure cause. For more information, see Retry a scheduled SQL instance.
Delay Task
The number of seconds for which the instance is delayed from the scheduled time. Valid values: 0 to 120. Unit: seconds.
If latency exists when data is written to the destination Logstore, you can use this parameter to ensure data integrity.
Download logs
You can download logs based on your business requirements to a local device or share the download URL with other users.
On the Graph tab, move the pointer over Download Log and select Download Log.
In the Log Download dialog box, configure the Task Name, Log Quantity, Data Format, Quote, Download Inaccurate Results, and Compression Method parameters.
Click OK.
In the Log Export History dialog box, wait until the logs are downloaded. After the logs are downloaded, perform operations based on your business requirements. The following table describes the operations.
NoteYou can also move the pointer over Download Log on the Graph tab and select Log Export History to view the log export history.
Operation
Description
Download logs to a local device
To download logs to a local device, find the download task that you want to manage and click Download in the Actions column.
Copy a resource URL
To copy a resource URL, find the download task that you want to manage and click Copy Resource URL in the Actions column. You can share the URL with other users so that they can use the URL to download the logs.
Configure a chart
Configure a chart of a specific type
You can configure common settings for the chart on the Common Settings tab. For example, you can select a color to display the results of the query statement for the chart. The chart attributes that you configure on the Common Settings tab take effect on the entire chart.
The common settings include the basic settings, standard settings, and attributes for a specific chart. For more information, see the Common Settings tab section of the "Attributes of charts (Pro)" topic.
Configure fields
You can configure custom display settings for the results of a single query statement or for a single column of data in the results. The chart attributes that you configure on the Fields tab take effect only on the chart generated based on the results of the selected query statement or a single column of data in the results. For more information about how to configure fields for different charts, see the Fields tab section of the "Attributes of charts (Pro)" topic.
Configure an interaction occurrence
Interaction occurrences are used to drill down a single field or the result of a single query statement. Interaction occurrences include events to open a Logstore, open a saved search, open a dashboard, open trace analysis, open trace details, customize an HTTP link, or associate datasets. The following example shows how to configure an event to open a Logstore.
On the Interaction Occurrences subtab of the Graph tab, click Add Field and select a field.
Click Add Event and select Open Logstore.
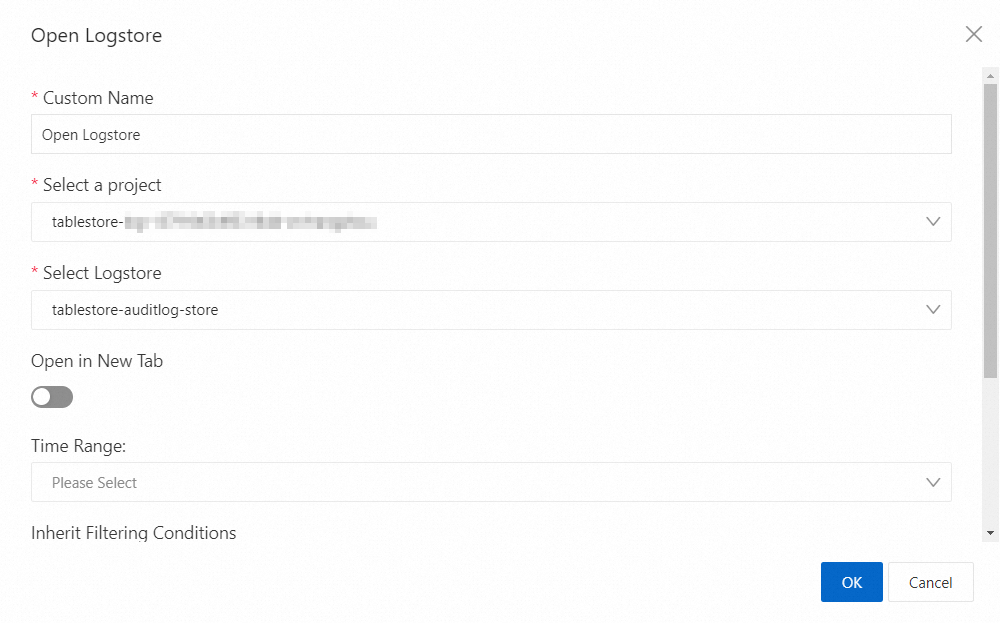
In the Open Logstore dialog box, configure the parameters that are described in the following table.
For more information about the parameters of interaction occurrences, see Drill-down events.
Parameter
Description
Custom Name
The name of the drill-down event.
Select a project
The project to which the Logstore belongs.
Select Logstore
The Logstore that is created. When the drill-down event is triggered, you are navigated to the page of the Logstore.
Time Range
The time range of the data to query in the Logstore. You can use one of the following time ranges:
Default time range: After you click a value in the chart that you create and you are navigated to the page of the Logstore, the time range on the page of the Logstore is the default time range, which is 15 Minutes(Relative).
Chart time range: After you click a value in the chart that you create and you are navigated to the page of the Logstore, the time range on the page of the Logstore is the time range of the chart when the drill-down event is triggered.
Relative time range: After you click a value in the chart that you create and you are navigated to the page of the Logstore, the time range on the page of the Logstore is the relative time range that you specify for the Time Range parameter.
Time frame: After you click a value in the chart that you create and you are navigated to the page of the Logstore, the time range on the page of the Logstore is the time frame that you specify for the Time Range parameter.
Inherit Filtering Conditions
If you turn on Inherit Filtering Conditions, the filter conditions that are added to your dashboard are synchronized to the Logstore. Then, you can enter a query statement after the filter conditions. The query statement and the filter conditions are evaluated by using the
ANDoperator.Filter Statement
The filter statement, which can be synchronized to the Logstore. You can enter a query statement after the filter statement. The two statements are evaluated by using the
ANDoperator.You can click Add Variable to add variables to the filter statement. The following list describes important system variables:
${{__start_time__}}: the start time of a query.${{__end_time__}}: the end time of a query.${{__interval__}}: the interval at which a query is performed. Unit: seconds.${{__project__}}: the name of the project to query.
After you add a variable, the value of the variable is used as a filter condition.
Click OK.