You can use CloudMonitor to monitor Tablestore metrics such as the running status, performance, and metering of Tablestore. These metrics help you track requests, analyze usage, collect statistics for business trends, and discover and diagnose system problems at the earliest opportunity. This topic describes how to query Tablestore metrics by using the CloudMonitor console or calling the DescribeMetricList API operation.
Usage notes
- The Tablestore metrics available vary based on the resource types. For information about metrics, see Metrics.
- The collection of monitoring data statistics may be delayed.
View monitoring data by using the CloudMonitor console
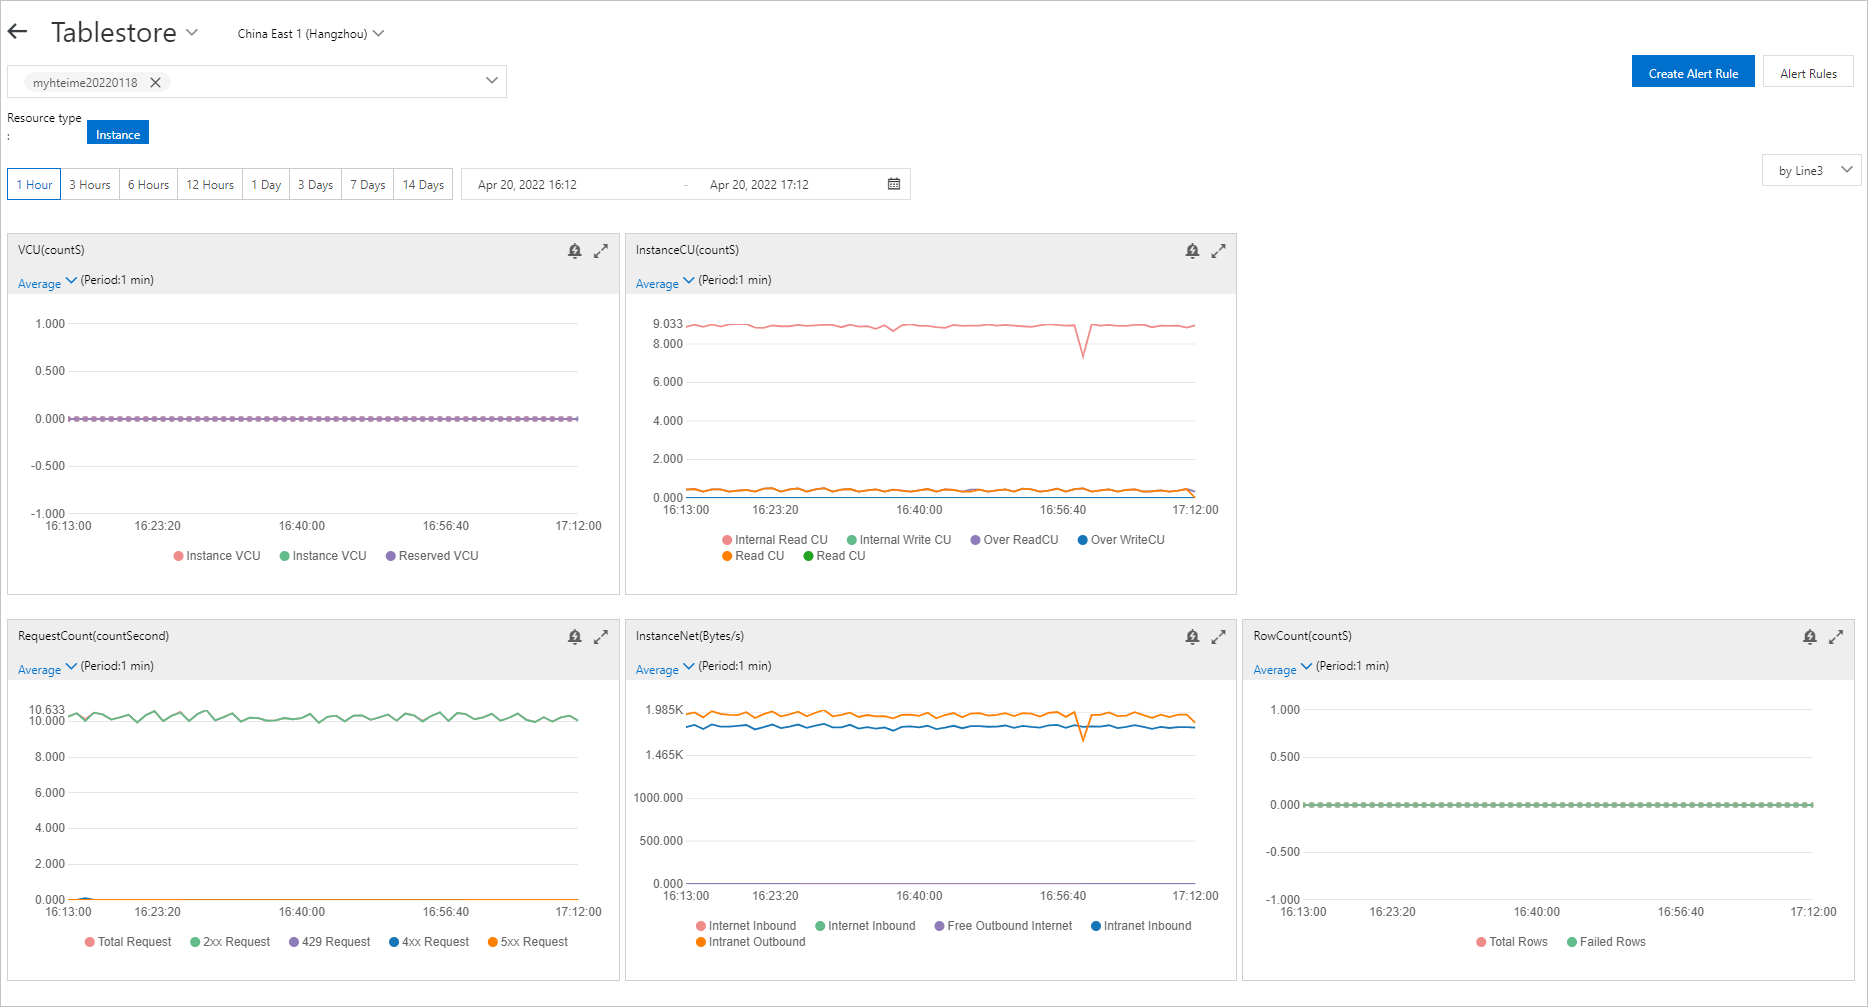
CloudMonitor automatically retrieves the resources of cloud services that belong to the current Alibaba Cloud account. You can view monitoring data of Tablestore instances such as the usage of VCUs per minute in reserved mode, average number of capacity units (CUs) that are consumed per minute in on-demand mode, average number of requests per minute, and average amount of traffic that is used per minute in the CloudMonitor console.
Log on to the CloudMonitor console.
In the left-side navigation pane, click Cloud Service Monitoring.
On the Cloud Service Monitoring page, choose .
On the Tablestore page, select a region. Then, click the name of the instance that you want to manage or click Monitoring Charts in the Actions column of the instance that you want to manage.
Specify a time range.
You can select a preset time range or specify a time range. The time range cannot exceed 30 days.
View monitoring data by using CloudMonitor SDKs
You can call the DescribeMetricList operation of CloudMonitor to view the monitoring data of specific metrics.
You can use CloudMonitor SDKs to view the monitoring data of Tablestore instances such as the average number of CUs that are consumed per minute in on-demand mode, the number of read CUs for operations in an instance per second, and the number of requests that return status codes 2xx per second. You can also use CloudMonitor SDKs to view monitoring data of data tables or secondary indexes such as the average operation latency, the number of requests that return status codes 2xx per second, and the number of read CUs for operations per second.
For information about the sample code of CloudMonitor SDKs, see SDK reference.
Namespace
The Namespace parameter is used to specify the cloud service that you want to monitor. If you want to monitor the Tablestore service, set Namespace to acs_ots_new.
The following code provides an example on how to use CloudMonitor SDK for Java to monitor the Tablestore service:
DescribeMetricListRequest request = new DescribeMetricListRequest();
request.setNamespace("acs_ots_new");
StartTime and EndTime
StartTime and EndTime specify the time range to query monitoring data. The time range in CloudMonitor is a left-open and right-closed interval in the (StartTime, EndTime] format. You can query data based on the time range from StartTime to EndTime (excluding StartTime).
The interval between start time and end time cannot exceed 31 days. Only data generated within the last 31 days can be queried.
The following code provides an example on how to use CloudMonitor SDK for Java to query monitoring data based on the specified time range:
// Specify the end time based on which you want to query monitoring data.
request.setEndTime("2022-06-13 11:23:00");
// Specify the start time based on which you want to query monitoring data.
request.setStartTime("2022-06-13 10:23:00");
You can also specify a time range by using timestamps in milliseconds. Sample code:
// Specify the timestamp of the end time based on which you want to query monitoring data. Unit: milliseconds.
request.setEndTime("1655090580000");
// Specify the timestamp of the start time based on which you want to query monitoring data. Unit: milliseconds.
request.setStartTime("1655086860000");
Dimensions
The Dimensions parameter specifies the name of the instance or table whose monitoring data you want to query. The value of the Dimensions parameter is a JSON string. Example: {"userId":"1234567890****","region":"cn-hangzhou","instanceName":"myinstance","tableName":"mytable"}
The following code provides an example on how to use CloudMonitor SDK for Java to query the monitoring data of an instance:
// Specify the name of the instance whose monitoring data you want to query.
request.setDimensions("{\"userId\":\"1234567890****\",\"region\":\"cn-hangzhou\",\"instanceName\":\"myinstance\"}");
If you want to query metrics of a table, you must specify a value for the tableName parameter. The following code provides an example on how to use CloudMonitor SDK for Java to query the metrics of a table:
// Specify the name of the table whose monitoring data you want to query.
request.setDimensions("{\"userId\":\"1234567890****\",\"region\":\"cn-hangzhou\",\"instanceName\":\"myinstance\",\"tableName\":\"mytable\"}");
If you want to query the metrics of an instance or a table regarding a specific API operation, you must specify a value for the operation parameter. The following code provides an example on how to use CloudMonitor SDK for Java to query the metrics of a table regarding the PutRow operation:
You must set the operation parameter to the name of the API operation. For more information, see API Reference.
// Specify the name of the table and API operation whose monitoring data you want to query.
request.setDimensions("{\"userId\":\"1234567890****\",\"region\":\"cn-hangzhou\",\"instanceName\":\"myinstance\",\"tableName\":\"mytable\",\"operation\":\"PutRow\"}");
Period
The Period parameter specifies the cycle based on which the specified metrics are queried. The cycle based on which metering metrics are queried is 3,600 seconds. The cycle based on which other metrics are queried is 60 seconds. For information about metrics, see the "Metrics" section of the Overview topic.
Metric
The Metric parameter specifies the metric that you want to query.
The following code provides an example on how to use CloudMonitor SDK for Java to query a metric:
// Specify a value for the Metric parameter. In this example, Metric is set to InstanceCount2xxNumber.
request.setMetric("InstanceCount2xxNumber");
The following table describes the name of each metric.
Resource type | Metric | Dimensions | Description |
Instances | InstanceCount2xxNumber | userId, region, instanceName, and operation | The number of requests that return status codes 2xx per second. |
InstanceCount429Number | userId, region, instanceName, and operation | The number of requests that return status code 429 per second. | |
InstanceCount4xxNumber | userId, region, instanceName, and operation | The number of requests that return status codes 4xx per second. | |
InstanceCount5xxNumber | userId, region, instanceName, and operation | The number of requests that return status codes 5xx per second. | |
InstanceElasticVCU | userId, region, and instanceName | The number of metered VCUs per second in reserved mode of an instance. | |
InstanceExtranetIn | userId, region, instanceName, and operation | The amount of inbound traffic over the Internet per second. Unit: bytes. | |
InstanceExtranetOut | userId, region, instanceName, and operation | The amount of outbound traffic over the Internet per second. Unit: bytes. | |
InstanceFailRowCount | userId, region, instanceName, and operation | The number of rows on which the operations failed per second. | |
InstanceFreeExtranetOut | userId, region, instanceName, and operation | The amount of free outbound traffic over the Internet per second. Unit: bytes. | |
InstanceFreeReadCU | userId, region, instanceName, and operation | The number of internal read CUs per second. | |
InstanceFreeWriteCU | userId, region, instanceName, and operation | The number of internal write CUs per second. | |
InstanceIntranetIn | userId, region, instanceName, and operation | The amount of inbound traffic over the internal network per second. Unit: bytes. | |
InstanceIntranetOut | userId, region, instanceName, and operation | The amount of outbound traffic over the internal network per second. Unit: bytes. | |
InstanceOverReadCU | userId, region, instanceName, and operation | The number of excess read CUs of an instance per second. | |
InstanceOverWriteCU | userId, region, instanceName, and operation | The number of excess write CUs of an instance per second. | |
InstanceReadCU | userId, region, instanceName, and operation | The number of read CUs for operations in an instance per second. | |
InstanceRequestNumber | userId, region, instanceName, and operation | The total number of requests per second. | |
InstanceReservedVCU | userId, region, and instanceName | The number of reserved VCUs per second in reserved mode of an instance. | |
InstanceRowCount | userId, region, instanceName, and operation | The total number of rows on which operations are performed per second. | |
InstanceVCU | userId, region, and instanceName | The number of VCUs of an instance per second. | |
Tables (including data tables and secondary indexes) | AverageLatency | userId, region, instanceName, tableName, and operation | The average operation latency. Unit: microseconds. |
Count2xxNumber | userId, region, instanceName, tableName, and operation | The number of requests that return status codes 2xx per second. | |
Count429Number | userId, region, instanceName, tableName, and operation | The number of requests that return status code 429 per second. | |
Count4xxNumber | userId, region, instanceName, tableName, and operation | The number of requests that return status codes 4xx per second. | |
Count5xxNumber | userId, region, instanceName, tableName, and operation | The number of requests that return status codes 5xx per second. | |
ExtranetIn | userId, region, instanceName, tableName, and operation | The amount of inbound traffic over the Internet per second. Unit: bytes. | |
ExtranetOut | userId, region, instanceName, tableName, and operation | The amount of outbound traffic over the Internet per second. Unit: bytes. | |
FailRowCount | userId, region, instanceName, tableName, and operation | The number of rows on which the operations failed per second. | |
FreeExtranetOut | userId, region, instanceName, tableName, and operation | The amount of free outbound traffic over the Internet per second. Unit: bytes. | |
StorageSize | userId, region, instanceName, tableName, and operation | The volume of data that is stored in the table. Unit: bytes. | |
FreeReadCU | userId, region, instanceName, tableName, and operation | The number of internal read CUs per second. | |
FreeWriteCU | userId, region, instanceName, tableName, and operation | The number of internal write CUs per second. | |
IntranetIn | userId, region, instanceName, tableName, and operation | The amount of inbound traffic over the internal network per second. Unit: bytes. | |
IntranetOut | userId, region, instanceName, tableName, and operation | The amount of outbound traffic over the internal network per second. Unit: bytes. | |
OverReadCU | userId, region, instanceName, tableName, and operation | The number of excess read CUs of a table per second. | |
OverWriteCU | userId, region, instanceName, tableName, and operation | The number of excess write CUs of a table per second. | |
ReadCU | userId, region, instanceName, tableName, and operation | The number of read CUs for operations per second. | |
RequestNumber | userId, region, instanceName, tableName, and operation | The total number of requests per second. | |
RowCount | userId, region, instanceName, tableName, and operation | The total number of rows on which operations are performed per second. | |
WriteCU | userId, region, instanceName, tableName, and operation | The number of write CUs for operations per second. |