After you enable the LogReduce feature, you can cluster logs and view the clustering results on the LogReduce tab. This topic describes the operations that you can perform on logs on the LogReduce tab.
Go to the LogReduce tab
The LogReduce feature allows you to cluster log data with high similarity and extract common log patterns, and provides an overview of logs. You can save log clustering results as charts to a dashboard and view the clustered log data in real time. For more information, see LogReduce.
Enable the LogReduce feature
On the LogReduce tab, click Enable LogReduce.
In the Enable LogReduce message, click OK.
Wait for about 1 minute until the LogReduce feature is enabled. Then, you can use the feature to cluster the log data that are written after the feature is enabled.
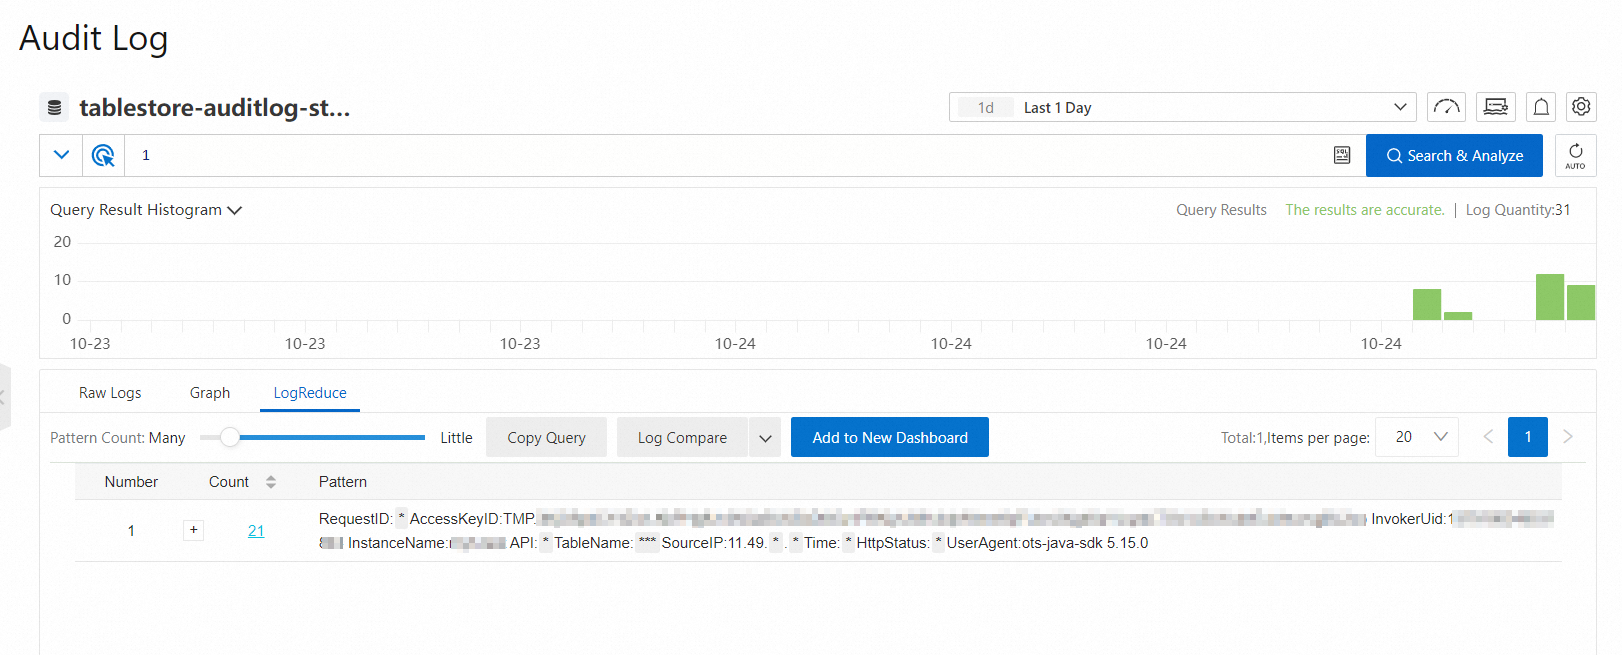
View log clustering results and raw logs
On the Audit Log page, enter a query statement in the query statement field, specify a time range, and then click Search & Analyze.
NoteYou can use only search statements to filter logs. You cannot use analytic statements to filter logs because the LogReduce feature cannot cluster analysis results.
Click the LogReduce tab to view the log clustering results.
Parameter
Description
Number
The ordinal number of the log cluster.
Count
The number of logs for the pattern in the specified query time range.
Pattern
The log pattern. Each log cluster has one or more sub-patterns.
Move the pointer over a number in the Count column to view the sub-patterns of the log cluster. You can also view the percentage of each sub-pattern in the log cluster. Click the plus sign (+) next to a number in the Count column to expand the sub-pattern list.
Click a number in the Count column. You are navigated to the Raw Logs tab. On this tab, you can view the raw logs of the pattern.
Change the precision of log clustering
On the LogReduce tab, you can adjust the Pattern Count slider to change the precision of log clustering.
If you adjust the slider toward Many, you can obtain a more precise log clustering result that has more detailed patterns.
If you adjust the slider toward Little, you can obtain a less precise log clustering result that has less detailed patterns.
Compare the number of logs that are clustered in different time ranges
On the LogReduce tab, click Log Compare.
Specify a time range and click OK.
For example, if you set the time range to 15 minutes when you query logs and specify 1Day for Log Compare, the start time and end time of log comparison are automatically displayed. The time ranges for comparison are the last 15 minutes on the current day and the same 15 minutes on the previous day.
Parameter
Description
Number
The ordinal number of the log cluster.
Pre_Count
The number of logs for the pattern in the time range that is specified by Log Compare.
Count
The number of logs for the pattern in the time range that is specified for the query.
Diff
The difference between the numbers of logs in the Pre_Count and Count columns and the growth rate.
Pattern
The log pattern.
Add log clustering results to a dashboard
A dashboard is used for real-time data analysis. You can save the log clustering results as charts to a dashboard.
On the LogReduce tab, click Add to New Dashboard.
In the Add to New Dashboard dialog box, create a dashboard or select an existing dashboard based on your business requirements.
Create a dashboard
Set the Operation parameter to Create Dashboard.
Set the Layout Mode parameter to Grid Layout or Free Layout.
Specify a name for the dashboard and a name for the chart.
Select an existing dashboard
Set the Operation parameter to Add to Existing Dashboard.
Select an existing dashboard and specify a name for the chart.
Click OK.