On the Raw Logs tab, you can view raw logs. This topic describes the operations that you can perform on logs on the Raw Logs tab.
Go to the Raw Logs tab
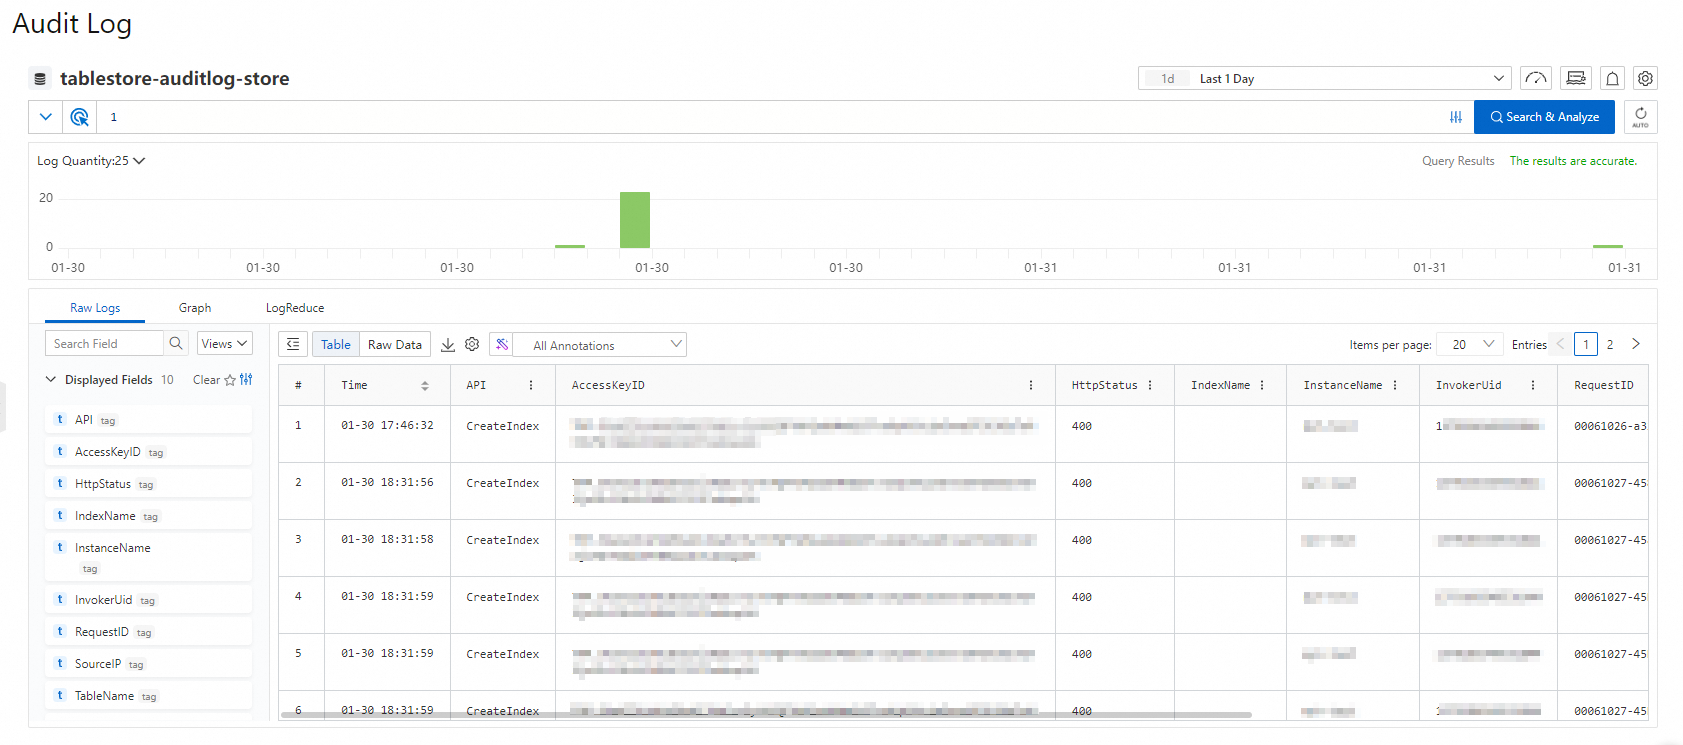
Quickly analyze logs
Configure log fields to be displayed
By default, the system displays the log fields that are supported by Tablestore. You can select a field to be displayed in the Indexed Fields section and click the  icon on the right side of the field to add the field to the Displayed Fields section.
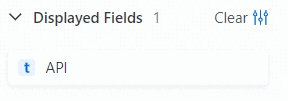
In this case, only the configured fields are displayed on the Table or Raw Data tab.
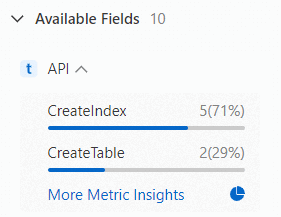
Quickly analyze log fields
The system automatically indexes Tablestore log fields and displays the analysis results.
In the Displayed Fields or Indexed Fields section, click the field that you want to view. The system automatically collects the metrics and displays the percentage of each metric.
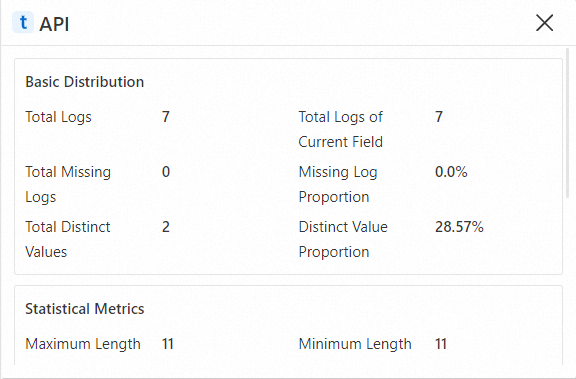
View more information about metrics
You can view the basic distribution of metrics, statistical metrics, and time series charts of top 5 fields. You can view more information about metrics by using one of the following methods:
In the Displayed Fields or Indexed Fields section, find the field that you want to view and click the
 icon on the right side of the field.
 In the Displayed Fields or Indexed Fields section, click the field that you want to view and then click More Metric Insights.
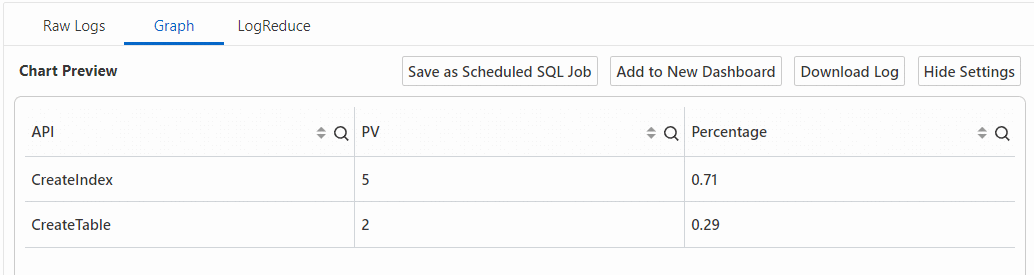
View statistical data of a field
You can view the charts of different metrics of a field.
In the Displayed Fields or Indexed Fields section, find the field that you want to view and click the  icon. The Graph tab appears and the system generates the corresponding analytic statement. On the Graph tab, you can view the charts of different metrics of the field. For more information, see.
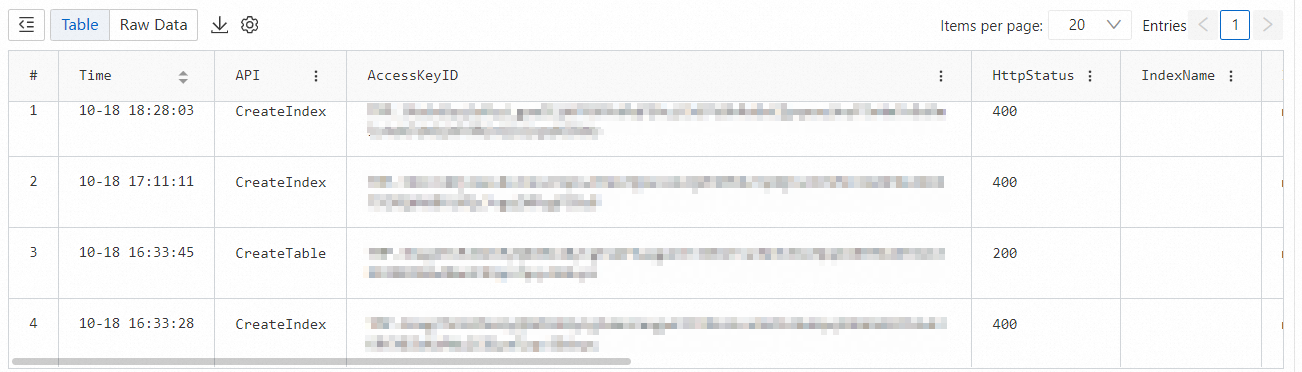
View logs in different modes
You can view logs in tables or view raw logs.
Click the Table tab to view logs in tables.
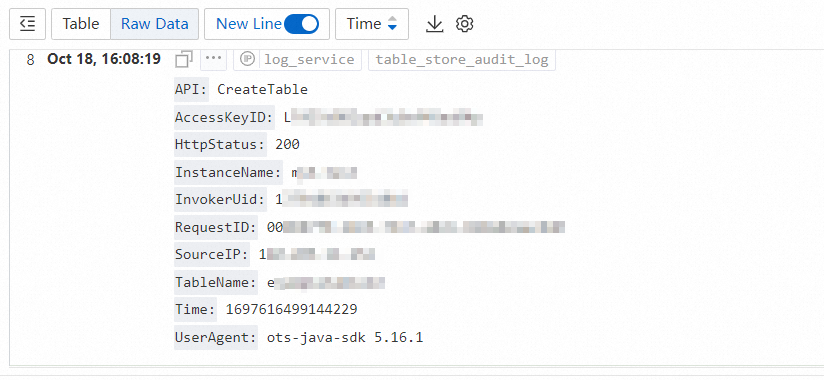
Click the Raw Data tab to view raw logs.
Download logs
You can download logs based on your business requirements to local storage or share the download URL with other users.
On the Raw Logs tab, move the pointer over the
 icon and select Download Log.
 In the Log Download dialog box, configure the Log Quantity, Data Format, Quote, Download Inaccurate Results, Compression Method, and Sorting Rule parameters.
Click OK.
In the Log Export History dialog box, wait until the logs are downloaded. After the logs are downloaded, perform operations based on your business requirements. The following table describes the operations.
NoteOn the Raw Logs tab, you can also move the pointer over the
icon and click Log Export History to view the log export history. Operation
Description
Download logs to local storage
Click Download in the Actions column of the download task.
Copy resource URL
Click Copy Resource URL in the Actions column of the download task and share the URL with other users. Other users can download the logs by using the URL.
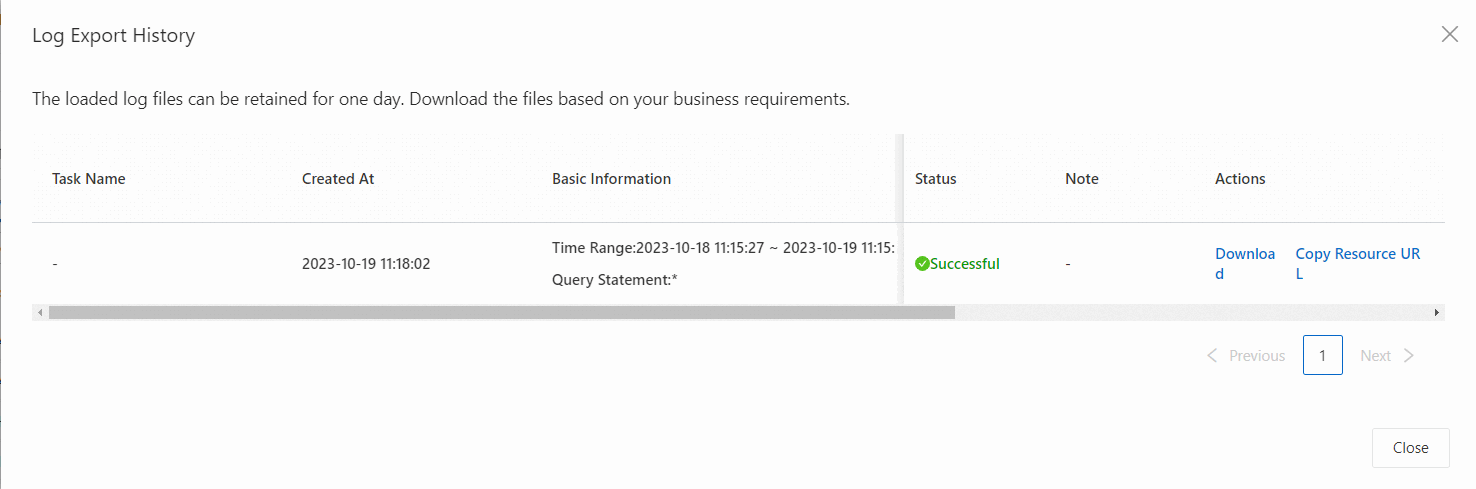
Click Close.
Configure events for logs
The audit log feature allows you to configure events for raw logs to visualize logs and obtain more log details. You can configure default events and advanced events for logs.
Configure default events
When you configure default events for logs, you can add conditions to query statements by using the AND and OR operators or create new query statements.
On the Raw Data tab, click a field value. A dialog box appears.
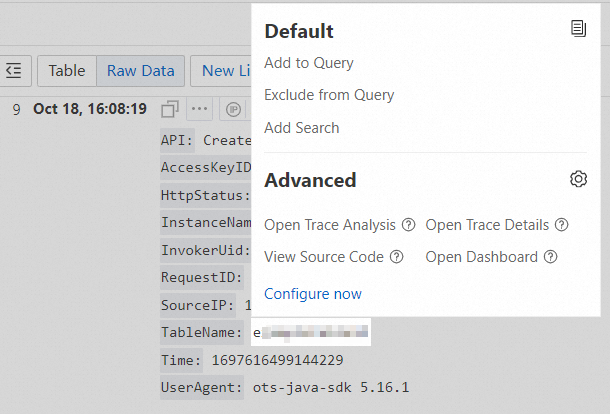
In the Default section, configure the default events. The following table describes the default events.
Event
Description
Add to Query
Append the keyword that you click to the query statement by using the AND operator and query the data.
Exclude from Query
Append the keyword that you click to the query statement by using the NOT operator.
Add Search
Delete the query statement from the search box and create a query statement by using the specified keyword.
Configure advanced events
You can configure advanced events for log fields to further analyze logs. You can configure an advanced event to open a Logstore, open a saved search, open a dashboard, open trace analysis, open trace details, customize an HTTP link, or associate datasets. The following example shows how to configure the event to open a Logstore.
On the Raw Logs tab, click the
 icon and select Event Settings.
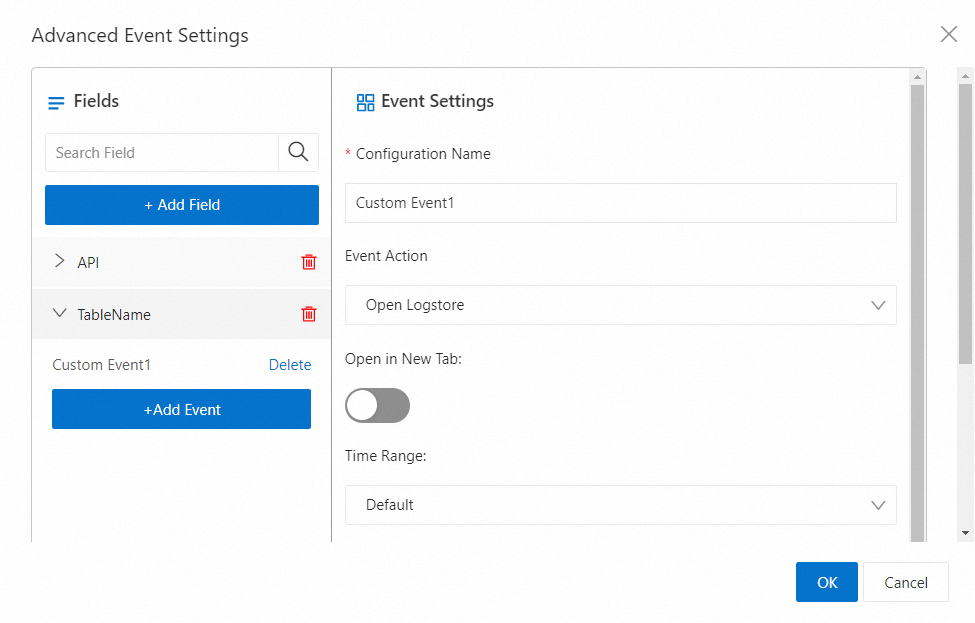
 In the Advanced Event Settings dialog box, click Add Field, select a field, and then click Confirm.
Click Add Event in the field.
In the Event Settings section, specify a configuration name and set the Event Action parameter to Open Logstore.
Configure the parameters that are described in the following table.
For more information about the parameters of events, see Configure events.
Parameter
Description
Configuration Name
The name of the advanced event.
Event Action
Select Open Logstore.
Open in New Tab
If you turn on this switch, the specified Logstore is opened in a new tab when the advanced event is triggered.
Time Range
The time range that is used to query the data in the specified Logstore. Valid values:
Default: The time range that is used to query the data in the Logstore to which you are redirected. The default time range is 15 Minutes (Relative).
Use Query Time: The time range that is used to query the data in the Logstore to which you are redirected. This time range is the same as the time range specified to query raw logs.
Relative: The time range that is used to query the data in the Logstore to which you are redirected. This time range is accurate to the second.
Time Frame: The time range that is used to query the data in the Logstore to which you are redirected. This time range is accurate to the minute, hour, or day.
Select Logstore
The name of the Logstore to which you want to be redirected. When an advanced event is triggered, you are redirected to the Logstore page.
Inherit Filtering Conditions
If you turn on the Inherit Filtering Conditions switch, the filtering conditions of the current query are synchronized to the destination Logstore by using the
ANDoperator.Filter
If you enter a filter statement on the Filter tab, the filter statement is synchronized to the destination Logstore by using the
ANDoperator.The filter statement can contain fields that you specify in the Optional Parameter Fields field. For example, if you click
${__topic__}, the variable is appended to the query statement of the destination Logstore by using theANDoperator.Variable
Not supported.
Click OK.